How to report spectral data in your reports
Spectral data is probably most clearly reported in tables. An example is shown below. *All* peaks must be included in your table – even those that do not belong to your product. We expect you to be able to assign all peaks belonging to your product and comment on any peaks due to contamination from other materials may be identified as "unknown contaminant". The paper referenced in the table below will come in very handy for assigning solvent peaks (*hint, hint*).
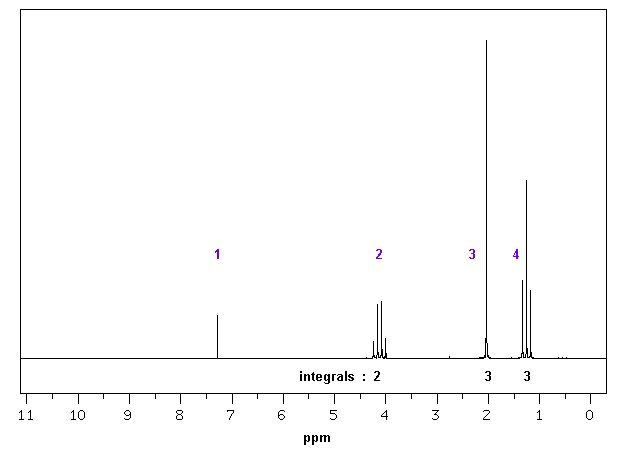
The image at the bottom of this page shows the NMR
spectrum for ethyl acetate (a.k.a ethyl ethanoate). Please note that
you will need to report the chemical shifts in ppm for your
peaks. Use the middle of any peak with a defined shape (i.e. a
singlet, doublet, triplet, etc.). For multiplets, report the range from
the left most signal in the multiplet to the right most signal.
Note that the assignment is written in such as way
that the structure of the molecule in the sample is correlated to the
observed spectral data, not as the spectral data being used to deduce
the structure of an unknown material.
Table of 1H NMR Data for Ethyl Ethanoate in CDCl3
|
Peak Number |
Chemical Shift (ppm) |
Integral |
Peak Shape |
|
|
1 |
7.26 |
s |
solvent, residual CHCl3
(from CDCl3)1 |
|
|
2 |
4.08 |
2 |
q |
The CH2
bonded to oxygen. The oxygen atom causes deshielding due to
electronegativity giving a typical chemical shift of 3-5ppm. The CH2 has 3 neighbouring
hydrogens attached on the adjacent carbon a quartet is observed. |
|
3 |
1.99 |
3 |
s |
The CH3 bonded to
carbonyl. The carbonyl group causes some
deshielding giving a typical chemical shift of 2-2.5ppm. Since the methyl group has no neighbouring hydrogens it is seen as a singlet. |
|
4 |
1.21 |
3 |
t |
The CH3 bonded to the CH2. Terminal methyl groups typically appear at 1.2ppm. Since the methyl group has 2 neighbouring hydrogens attached on the adjacent carbon a triplet is observed. |
1 Gottlieb, H. E.; Kotlyar, V.; Nudelman, A. J. Org. Chem., 1997,
62, 7512-7515.